Defects Per Million Opportunities (DPMO)
Defects per Million Opportunities factors in the total opportunities for defect occurrence existing in a process. DPMO is considered long-term measurement of a process and this can be directly converted into a long-term z-statistic (sigma value)
Given:
D: # of defects
O: # of opportunities for a defect
U: # of units
TOP: Total number of opportunities = U * O
Formula:
DPMO = DPO * 1,000,000
DPO = Defects per Opportunity
DPU = Defects per Unit
See the links or the example below to help understand the differences.
NOTE:
DPMO is NOT the same as PPM (parts per million) since it is possible that each unit (part) being appraised may be found to have multiple defects of the same type or may have multiple types of defects. A part is defective if it has one or more defects. The number of defectives can never exceed the number of defects.
IF each part only has one characteristic that can be a defect, then DPMO and PPM will be the same.
You could have 1,000,000 defects on one part and the DPMO could be 1,000,000 and the PPM is 1.0 if that part is the only part out of the million that has any defects (in other words the other 999,999 parts have 0 defects). This is an exaggeration to try and illustrate the difference between DPMO and PPM.
Also keep in mind that it's possible that each widget being measured (or assessed) has a different amount of potential defects. So theoretically you could have just a few widgets (very complex widgets) that have thousands of opportunities for defects or a lot of simple widgets that only have a few total opportunities for defects.
PPM represents the number of defective parts (units) per 1 million units
DPMO is the number of defects per 1 million opportunities of defects
DPMO Example
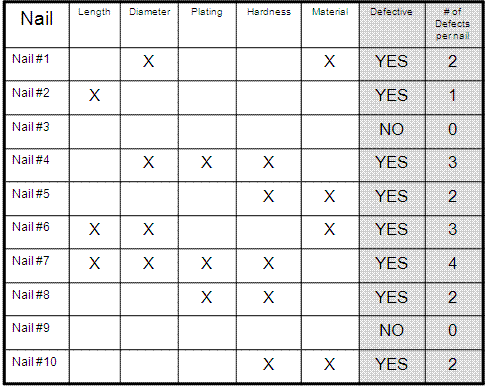
Examine the table shown below:
Nail #1 has two types of defects. Therefore it is ONE defective nail that contains TWO defects.

SUMMARY OF TABLE
D = 19 total defects
O = 5 opportunities (categories of defect types)
U = 10 nails
TOP = U * O = 50 total opportunities for defects
DPU = D / U = 19/10 = 1.9 defects per unit
DPO = D / TOP = 19/50 = 0.38
DPMO = 380,000
Out of a million opportunities, the long-term performance of the process would create 380,000 defects.
Notice that only Nail #3 and Nail #9 had zero defects. Therefore 8 out of 10 nails had at least one defect. That represents a PPM of 800,000.
Want to convert a DPMO of 380,000 to a z-score? Read below or click here to learn more about z-scores.
Using Excel to calculate Sigma and DPMO
There are a couple
commonly used Microsoft Excel functions that converts Defects per
Million Opportunities (DPMO) to a process sigma (z-score) and vice
versa.
To convert from DPMO to process sigma:
- Process Sigma (ST) = -NORMSINV(DPMO/1,000,000)+1.5
- Process Sigma (LT) = -NORMSINV(DPMO/1,000,000)
To convert from process sigma to DPMO:
- DPMO = 1000000*(1-(NORMSDIST*(process sigma-1.5))
To convert DPMO to % Defective
- DPMO / 1000000*100 = % Defective
NOTE:
A
Six Sigma quality process refers to the process short-term performance
or how it is performing currently when there are 3.4 DPMO. Over the long
term, this six sigma process is estimated to shift -1.5 sigma (lower)
and will perform at a 4.5 sigma level, which produces 1,350 DPMO.

DPMO Calculator (Six Sigma Calculator)
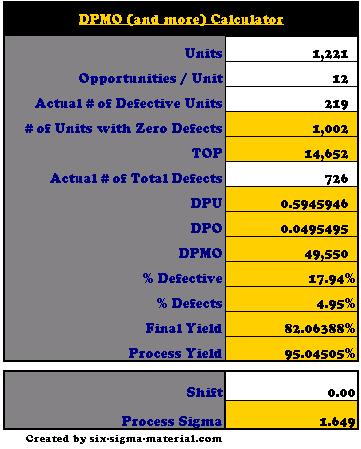
Enter your values in the white cells and everything else is calculated. Notes are in the actual template that offer more guidance and information on each row.
This calculator can give you a ZST (if you input a shift of +1.5) or ZLT score (if the shift is 0). This is shown at the bottom as the 'Process Sigma' value.
DPMO (and more) Calculator available for your Six Sigma project
Return to the Six-Sigma-Material Home Page
Recent Articles
-
Process Capability Indices
Oct 18, 21 09:32 AM
Determing the process capability indices, Pp, Ppk, Cp, Cpk, Cpm -
Six Sigma Calculator, Statistics Tables, and Six Sigma Templates
Sep 14, 21 09:19 AM
Six Sigma Calculators, Statistics Tables, and Six Sigma Templates to make your job easier as a Six Sigma Project Manager -
Six Sigma Templates, Statistics Tables, and Six Sigma Calculators
Aug 16, 21 01:25 PM
Six Sigma Templates, Tables, and Calculators. MTBF, MTTR, A3, EOQ, 5S, 5 WHY, DPMO, FMEA, SIPOC, RTY, DMAIC Contract, OEE, Value Stream Map, Pugh Matrix

Site Membership
LEARN MORE
Six Sigma
Templates, Tables & Calculators
Six Sigma Slides
Green Belt Program (1,000+ Slides)
Basic Statistics
Cost of Quality
SPC
Control Charts
Process Mapping
Capability Studies
MSA
SIPOC
Cause & Effect Matrix
FMEA
Multivariate Analysis
Central Limit Theorem
Confidence Intervals
Hypothesis Testing
Normality
T Tests
1-Way ANOVA
Chi-Square
Correlation
Regression
Control Plan
Kaizen
MTBF and MTTR
Project Pitfalls
Error Proofing
Z Scores
OEE
Takt Time
Line Balancing
Yield Metrics
Sampling Methods
Data Classification
Practice Exam
... and more


