Inventory

Inventory is usually seen as being a sin in business and it may be theoretically possible that none could be carried. But most often in reality, variation exist, and inventory is necessary in most organizations. Not all inventory is bad.
Excess Inventory is the evil sin. It also leads to others of the 7-Wastes (handling, storage). There is a difference between Inventory and Excess Inventory. One is planned and explained (while improvement still exists) and the other is a result of out-of-control inputs leading to waste and other side effects such as tying up a machine to make another product due.
Inventory Valuation
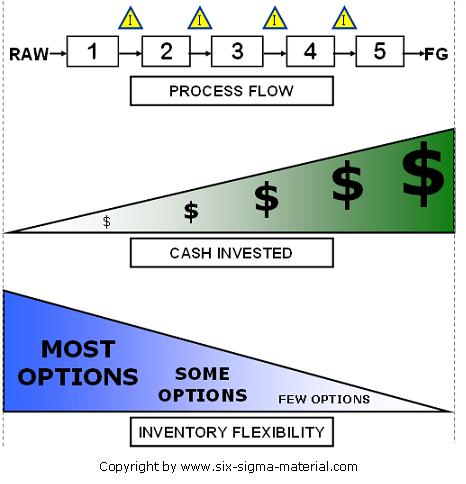
Product value increases as it is transformed throughout the process. Adding value to the material as it is processed results in higher inventory value. One piece at the beginning of the value stream IS NOT worth the same as a piece in Finished Goods (FG).
The further the transformation also restricts the flexibility to use this material (WIP) for another product. The goal is to commit the least amount of cost in material, labor resources, and overall working capital before the product is shipped.
And before the organization is paid, usually there are payment terms such as 30, 60, 90 days after the sale is official until the organization receives its cash.
Raw Material - at this point the inventory has the highest the most flexibility and options. Often it can be used among many products and has the lowest amount of dollars invested. Very little labor, tools, dies, indirect materials have been applied to get the raw materials.
Work-In-Process (WIP) - less flexible to changes in customer requirements and has some added value. The further down the value stream a product goes the more valuable it becomes.
For example, a yield of 99% at Process 1 is a lot less expensive than a yield of 99% at Process 5. Keep more pieces in earlier processes to allow most flexibility while tying up lowest amount of cash and still having the pieces to protect the customer already in process.
Finished Goods - lowest amount of flexibility in terms of customer needs and the maximum amount of dollars invested, unless the FG is handled multiple times after initially classified as FG. This is also the most likely to become obsolete since it cannot likely be economically transformed into another product to be sold.
Sea of Inventory
A popular way to visualize inventory is to think of:
1) Inventory as a body of water representing raw material, WIP, and finished goods.
2) Ships are the process that is trying to navigate through the water.
3) Rocks and boulders along the bottom are the obstacles of variation in the process.
When the water level is lower than the rocks these obstacles interfere with processes and problems arise making the path to success is difficult.
Weaving around variation within machine set-ups, supplier issues, forecasting inaccuracies, quality problems, and the other sources are most challenging to overcome.
The easiest route that can be taken is to raise the water level. In other words increase the inventory level to have "peace of mind" and cover the waste (or opportunity).
It's the easy solution as long as cash flow supports it and the variation and improvement opportunities exist and perhaps the correct decision to avoid a crisis and then systematically lean reduce the inventory over time.
An Inventory Reduction plan does not mean that an organization should immediately decide to drop inventory and then deal with the all the boulders. It means recognize the boulders through the DMAIC cycle and have the Six Sigma team address them.
You can take chances, chances with calculated risk, and don't be afraid to let some of the taller, larger boulders (problems) get exposed. It can help deliver a message, often the true magnitude can't be sensed until it inflicts some "pain" in the operation.
When the water levels are lowered, boulders must be removed. If not, customer deliveries will be missed, quality issues won't have insurance stock to cover the quarantined stock, and profits will be sacrificed, and customer perception and scorecard may be impacted.
Some of the reasons inventory is carried:
- Process variation (machines - poor TPM)
- Low OEE's
- Process variation (from non-standard work)
- Protects the company from inefficiencies
- History of unplanned downtime
- Subassembly issues
- Manpower instability
- Indirect Material instability (tools, dies, forms, oil)
- Product complexity
- Un-leveled scheduling
- Forecast unreliability
- Low yields, variable scrap rates
- Unbalanced Workload
- Past paradigms and acceptance of overproduction
- Long lead times
- Suppliers problems
- Compensation structures (bonuses) - read below
The final bullet point is a strategy applied by short-term thinking leaders within companies that use absorption accounting practices. An increase in inventory at the end of a financial period can improve the gross margin on paper, by spreading the fixed costs over more pieces.
The Cost of Goods Sold (COGS) is driven lower for the period and then taking the Sales - COGS = inflated profit.
The downside is that this will catch up to the company and the opposite should occur in the long run (assuming you can't build inventory to a higher level infinitely). Moreover, this hinders cash flow by tying it up in goods available for sale - not yet sold.
There are plenty of cases that have found bonus programs structured around PROFIT, without consideration to the sub-optimization of cash flow or inventory on hand and this measurement behavior can sway behaviors toward building inventory. People collect their bonus and exit the company. This is an ethics issue being driven by a poor measurement system. People tend to behave how they are measured.
Six Sigma's role in Inventory Control
Inventory should exist for a couple of reasons:
- Buffer, cover the variation that will likely always exist but strive to minimize
- Satisfy customer demand
Reducing variation enables inventory reduction and not the other way around. Six Sigma is centered on VARIATION reduction.
Not all inventory is bad since every process has some amount of variation (hopefully common cause only). The goal of Six Sigma is to reduce variation and in this case reducing the variation in any or all of the inputs listed above in the bullet points. This will improve stability, repeatability, control, and allow for permanent inventory reduction.
As long as there is uncontrolled variation, an organization must carry inventory to cover the "just-in-cases" or risk jeopardizing a customer, shutting down an assembly line, or negatively impacting their performance scorecard.
Inventory is comforting. The more variation, uncertainty, and inefficiencies there are, the more inventory is needed to stay comfortable. However, this comes at a price of higher costs and hinders cash flow (also storage space and excess handling).
Production Systems
1) Build to Order (BTO) systems have the lowest amount of potential and overall inventory on hand, only if an organization is truly building to a specific order and all will be shipped and sold - every time. The idea is to build the right product, at the right time, in the right quantity to meet customer specific order.
2) Pull Systems carry the second most amounts of inventory. These are replenishment systems based on Kanban (or certain level of stock). The benefit is level loading in the production environment and replace only what is pulled in level amounts each time. There will always be inventory at the end when a product goes obsolete (unless communication is advanced to detect this and prevent this on the final release). This system requires a degree of stability in the pull (shipment history), the forecast is irrelevant.
3) MRP/Forecast/Push Systems carry the most inventory and are the most common system still found in most organizations. Trying to rely on human developed models and forecast is risk.
Replacing what was pulled based on a history does not lie, but building to a forecast, especially with long lead time products or within a dynamic market, is high risk and exposes a lot of variation. Therefore, excess inventory is carried all the time resulting in a constant, higher level of cash tied up than a BTO or Pull System and a higher level of excess inventory when a product becomes obsolete.
Common Organizational Message
Inventory is a lagging metric. It is a result of inputs and is not a variable switch that can be controlled itself without serious risks to customer delivery timeliness.
Organizations frequently target inventory reduction to free up cash. Metrics they drive include a lower DIOH (Days Inventory On Hand) or increased Inventory Turns. This is a great idea and good thing to target to improve cash flow, but the focus should be on fixing the key inputs that are causing the need to carry the inventory.
The metrics should be on-time delivery of suppliers, indirect material stability, Kanban card audits, or on other important leading indicators that cover most valuable organizational value streams.
Inventory is not a lever that is turned on and off or down or up without a plan and system to explain it. Lead time must be reduced (the mean) and the variation within the value stream must be first controlled, then reduce the common cause. This will automatically lead to better cash flow.
Better cash flow allows an organization to lower their leverage, invest in other opportunities, meet shareholder expectation that promotes more investment, improve credit ratings and borrowing capability, and many more. Most of the same reasons we watch our inventory at home.
ANALOGY:
Why don't we buy 10 gallons of milk at one time? We know that we will eventually consume all 10 gallons so why not buy it all at once.
It will save me trips to the store and handle it all at once (large batch - one set up mentality) and forget about for a long time.
These below are the same responses for a business.
1) It won't leave cash for other groceries or to pay the mortgage, keep the lights on, pay for health care, etc.
2) It will spoil before use. There are products have a shelf life such as some steel products, they may rust over time.
3) It costs to store. Is it worth buying two more refrigerators and dedicating square footage of your home to storing milk? Just like a business, that space could be leased out, not purchased at all, or used for machinery.
Inventory Reduction Strategies
FIRST
The first step to protect a customer where shutdown and missed shipments are very high risk (such as JIT customers aerospace or automotive markets - shutting down an assembly line will cost so much money that an organization could have been better off carry a whole lot more inventory instead) is to keep the same amount of pieces in the value stream but keep them at a lower value.
That is, try to hold the at the second to last process and some more at the next process upstream. In other words, the pieces are in WIP and the costs to put them into FG early have not been applied. This also allows handling and storage space for only the amounts that are actually needed.
SECOND
Wilfred Pareto's principle of 80/20. Focus on the 20% of the items that make up 80% of the total inventory dollars. A small lead time improvement in those value streams will have the most significant cash flow improvement.
THIRD
A common theme pushed is to reduce set-up time. While this is always ideal, it may not provide the biggest bang for the buck. A Six Sigma team should strive to remove the largest amount of time to reduce the mean lead time of a value stream AND the input creating the most variation within the value stream (whether it is in one process or multiple, systems, transactional, or elsewhere).
FOURTH
Put the tightest control with the strongest poka-yokes around the high dollar products. After that, put medium controls and resources towards the mid-level valued products. As time goes on more attention can be focused on the non-vital few working your way down the Pareto Diagram.
FIFTH
If you're struggling with suppliers and there appears to be low chance of improvement, then bite the bullet here with adding more inventory of raw material and indirect materials.
Do so carefully and with moderation, don't forget to seek approval from finance and Six Sigma organization. But the value stream MUST have stable inputs into the processes (others include stable manpower, machine uptime). Raw materials, sub-assemblies systems, must be available and reliable to start any deep dive into the value stream.
It is recommended that all these materials and indirect materials are put on a KANBAN system to avoid running out BUT if there is so much instability in their delivery or availability then a Kanban system will not be effective either.

Site Membership
LEARN MORE
Six Sigma
Templates, Tables & Calculators
Six Sigma Slides
Green Belt Program (1,000+ Slides)
Basic Statistics
Cost of Quality
SPC
Control Charts
Process Mapping
Capability Studies
MSA
SIPOC
Cause & Effect Matrix
FMEA
Multivariate Analysis
Central Limit Theorem
Confidence Intervals
Hypothesis Testing
Normality
T Tests
1-Way ANOVA
Chi-Square
Correlation
Regression
Control Plan
Kaizen
MTBF and MTTR
Project Pitfalls
Error Proofing
Z Scores
OEE
Takt Time
Line Balancing
Yield Metrics
Sampling Methods
Data Classification
Practice Exam
... and more


