The Cost of Poor Quality (COPQ)
The Cost of Quality is made up four cumulative areas:
The Cost of Poor Quality is the sum of just 3 & 4:
COPQ = Internal Failure Costs + External Failure Costs
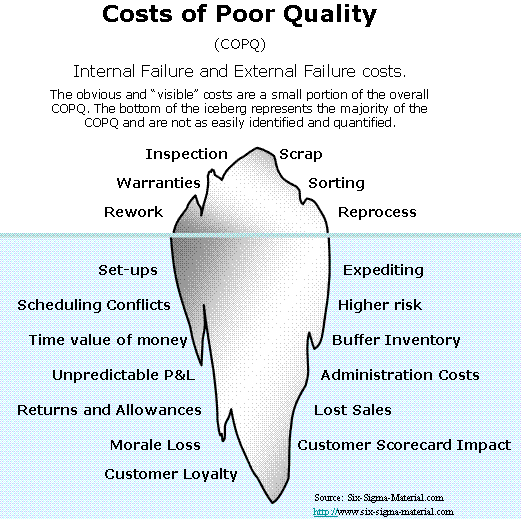
The picture below illustrates the some of the costs associated with poor quality. All of these represent areas of opportunity.
PREVENTION – cost of devices and actions to prevent defects in products and services.
APPRAISAL – cost of devices
and actions to assessing products and services to verify conformance to customer requirements.
FAILURE – these are
considered the Cost of Poor Quality (COPQ). The costs from products and services not meeting customer expectations.
Internal Failure – costs of failure prior to shipment to the
customer such as scrapping parts
that are in finished goods.
External Failure – costs of failure after, or during, shipment to the customer such as scrapping parts that are in finished goods.
Three Degrees of Product Costs
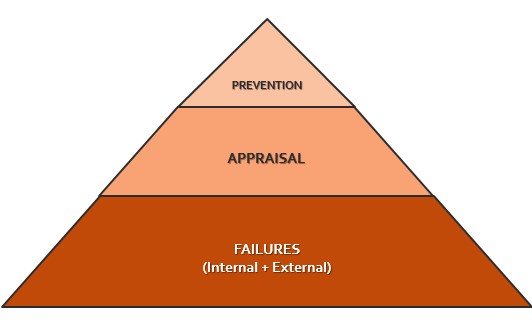
Most common state
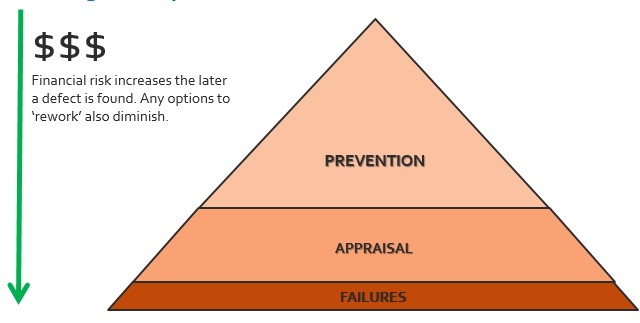
More Ideal State
Obviously, a product that can be produced with no cost related to quality is the perfect state but probably not practical. Therefore, the ideal focus for the team is to direct more cost toward prevention and appraisal and at a lower overall costs than the "current" state.
Examples of COQ
Examples of PREVENTION costs
- Capability studies
- Operator Training
- Engineering and Design Reviews
- SOP’s
- Poka-Yoke devices
- Testing, piloting, trials
- Interviews, screening process, preliminary analysis
- Forecasting, predictions, modeling
- Preventive maintenance of machines, devices, tools, dies.
Examples of APPRAISAL costs
- Inspections at all stages
- In process auditing
- Equipment calibration
- Laboratory testing
Examples of INTERNAL FAILURE costs
- Rework
- Scrap (before shipment to customer)
- Sorting
- Obsolete inventory / Excess Inventory
- Re-inspection and Re-testing
- Employee turnover
- Excess freight
Examples of EXTERNAL FAILURE costs
- Scrap parts after shipment to customer
- Returns
- Restocking
- Redesign
- Customer complaints and impact on scorecard
- Penalties related to all the above, lost business, lawsuits, recalls
- Premium freight
- Sorting
NOTE: Some of these examples can appear on the INTERNAL FAILURE
lists too. Don’t get caught up in this detail. Just pick a category and stay
consistent in your definition and measurement.
More about COQ
Some say the cost of PREVENTION is 1/7th of the cost of FAILURE. This is a generic claim and highly dependent on the nature of each business but as the saying goes “an ounce of prevention is worth a pound of cure”.
The value of a customer is best measured by their LIFETIME WORTH. Repetitive purchases and the possible spread of good news to other potential customers for a “lifetime” is the best a company can target. • Loyalty and Retention Worth may be options on an exam and are good responses but the best answer is LIFETIME WORTH.
Juran and Gryna are credited with developing the Optimum Quality Cost Model that shows that as Prevention and Appraisal costs increase, the costs of Failures decrease until a optimal value is achieved.
COPQ Hidden Costs
Some costs are not as obvious as others. Often, it is found that a majority of the costs related to COQ in a company is resides in the “FAILURES” category (both internal and external).
- The % of money devoted to PREVENTION is often the lowest by a significant margin.
- A shift of resources to COQ from COPQ takes time and this is one reason it is often foregone.
- And once the money is shifted among PREVENTION and APPRAISAL, it’s easier to simply inspectors or inspect more parts OR just roll the dice and hope there are not any failure costs.
- The challenge is most often getting the time and resources to dedicate to PREVENTION.
COQ in the workplace
Often times companies will relate the Cost of Quality as a percentage of sales (% Sales). However, a different standard may apply to your model or business.
A better metric could be measuring the Cost of Quality as a % of Cost of Goods Sold (COGS). This removes the margin variation and eliminates product "mix" influences.
The first goal is to have all the cost of quality in the Appraisal and Prevention areas and zero Costs of Poor Quality.
Then, work to streamline any remaining costs without sacrificing the quality.
It can be challenging to standardize a calculation and many forms of the calculation exist. There are many obvious direct costs that can be categorized into one of the four areas but most of the costs are indirect and more difficult to quantify.
Work with the financial representative to help quantify and validate hard and soft savings.
Each company should come up with a standard with definitions for their formula. This is the same concept behind making a measurement system repeatable and reproducible.
Create a set of examples to help explain the costs and where they should be allocated.
Examples could be provided to Controllers and financial representatives to check for reproducibility and repeatability. In other words, perform a variable data MSA on the Cost of Poor Quality measurement system to help fine tune the calculation and standard operating procedure or work instruction.
Don't allow the details to interfere with going forward with a COPQ procedure. It can be refined while in use and savings could be at risk without any attention at all.
The COPQ becomes visible evident for the first time in a DMAIC project when a actual state detailed Process Map is created. The team will be surprised how frequently their is detection, appraisal, rework, scrap, or other COPQ related costs. The perfect state should strive to eliminate COPQ but reality is that not all can be economically eliminated. However simply understanding and growing the awareness and measuring the COPQ alone will usually lead to better results.
The actual improvements from the team will help with a fundamental shift of the results and a solid Control Plan and handoff will most importantly...CONTROL the future variation and SUSTAIN the gains.
7-Wastes
COPQ is often summarized as findings within 7-Wastes, or also referred to as the 7 forms of Muda. Click here to learn more.
COQ Example
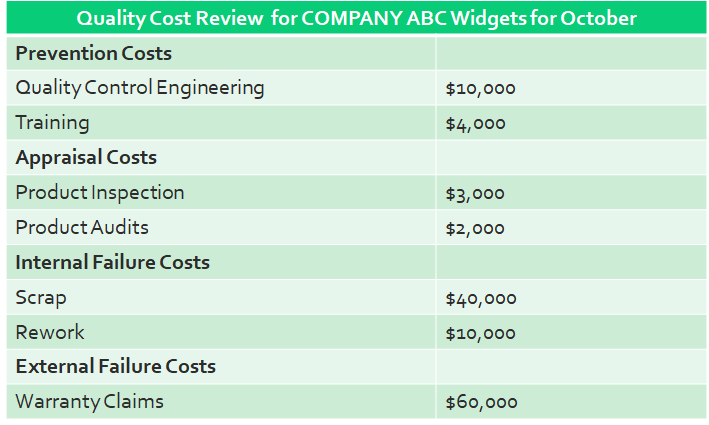
What’s the Cost of Quality (COQ) as a % of Sales if Sales are $1,000,000?
 COPQ Example at Six-Sigma-Material.com
Summing up all four categories, the total COQ is $129,000 (FYI: the COPQ portion is $110,000)
Therefore, $129,000 / $1,000,000 = 12.9% is the COQ as a % of Sales
Other observations:
- Failure related costs are $110,000 Prevention + Appraisal costs are $19,000
- The Failure Costs are nearly 6x the Prevention + Appraisal Costs and nearly 8x just the Prevention Costs
- COPQ as % Sales = $110,000 / $1,000,000 = 11%.
In summary, this isn't an ideal state. Too much costs are being incurred in the later stages (failures). The Six Sigma team should focus on Prevention and Appraisal investments to reduce the overall COQ.
Return to the DEFINE Phase
Return to the MEASURE Phase
Return to LEAN MANUFACTURING
Six Sigma job postings
Return to Six-Sigma-Material Home Page

Site Membership
LEARN MORE
Six Sigma
Templates, Tables & Calculators
Six Sigma Slides
Green Belt Program (1,000+ Slides)
Basic Statistics
Cost of Quality
SPC
Control Charts
Process Mapping
Capability Studies
MSA
SIPOC
Cause & Effect Matrix
FMEA
Multivariate Analysis
Central Limit Theorem
Confidence Intervals
Hypothesis Testing
Normality
T Tests
1-Way ANOVA
Chi-Square
Correlation
Regression
Control Plan
Kaizen
MTBF and MTTR
Project Pitfalls
Error Proofing
Z Scores
OEE
Takt Time
Line Balancing
Yield Metrics
Sampling Methods
Data Classification
Practice Exam
... and more


