IMPROVE
Welcome to the 4th phase of a DMAIC Project

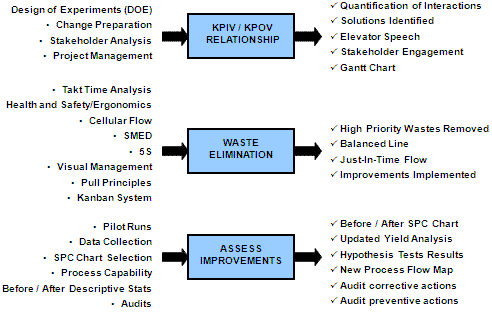
The IMPROVE phase requires understanding the KPIV's that are causing the effect. This phase helps determine the relationships of these key variables to the project "Y" and lead to improvement ideas. All the hard work done previously lacks merit unless there is implementation.
This is the phase of the project where all the team's work gets put into action and the rubber meets the road for hard driving. The solutions have been identified and the implementations to reduce variation and improve target performance are executed. Without making the improvements, all the hard work and invested time amounts nothing. This is a good time for an Elevator Speech!
It may be necessary to once again conduct a Stakeholder Analysis to ensure the team is ready to promote the change, drive the change, and walk the talk. A portion of implementations may "shock" the workplace culture. Be prepared for employees resistance to a cultural change. Getting past this is every bit as important as technical execution.
Remove as much waste as possible, accept no alternative! Solid education and analysis has identified these areas of opportunity in earlier phases.
A relentless drive to not only remove waste to increase the value-added time but to increase the value of the value-added processes. As improvements are made, more will come to the surface. The team will need a timeline, such as a Gantt Chart, to track assignments and timeliness of there completion.
Pilot runs will be taken at the end of the IMPROVE phase and data collecting to begin the BEFORE and AFTER performance will start.
The outputs of the IMPROVE phase are needed to begin the CONTROL phase.
Some of the tools commonly used in the IMPROVE phase are shown below.
Stakeholder Analysis
Mistake Proofing (Poka-Yoke)
Designing Workcells / Cellular Flow
SMED: Single Minute Exchange of Dies
DESIGN OF EXPERIMENTS
Design of Experiments (DOE) - overview
Evolutionary Operations (EVOP)
Proceed to final DMAIC Phase: CONTROL
Return to the Six-Sigma-Material Home page
Recent Articles
-
Process Capability Indices
Oct 18, 21 09:32 AM
Determing the process capability indices, Pp, Ppk, Cp, Cpk, Cpm -
Six Sigma Calculator, Statistics Tables, and Six Sigma Templates
Sep 14, 21 09:19 AM
Six Sigma Calculators, Statistics Tables, and Six Sigma Templates to make your job easier as a Six Sigma Project Manager -
Six Sigma Templates, Statistics Tables, and Six Sigma Calculators
Aug 16, 21 01:25 PM
Six Sigma Templates, Tables, and Calculators. MTBF, MTTR, A3, EOQ, 5S, 5 WHY, DPMO, FMEA, SIPOC, RTY, DMAIC Contract, OEE, Value Stream Map, Pugh Matrix

Site Membership
LEARN MORE
Six Sigma
Templates, Tables & Calculators
Six Sigma Slides
Green Belt Program (1,000+ Slides)
Basic Statistics
Cost of Quality
SPC
Control Charts
Process Mapping
Capability Studies
MSA
SIPOC
Cause & Effect Matrix
FMEA
Multivariate Analysis
Central Limit Theorem
Confidence Intervals
Hypothesis Testing
Normality
T Tests
1-Way ANOVA
Chi-Square
Correlation
Regression
Control Plan
Kaizen
MTBF and MTTR
Project Pitfalls
Error Proofing
Z Scores
OEE
Takt Time
Line Balancing
Yield Metrics
Sampling Methods
Data Classification
Practice Exam
... and more


