Conversion Tables
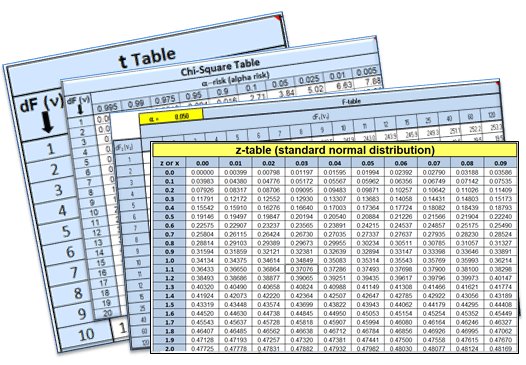
Select the links below to see commonly referenced tables. Within the links are explanations and examples. BE CAREFUL when using tables. There are many variations and all can be correct but only when interpreted correctly. Some tables are for one-tailed test and others cover two-tailed test.
There are several tables along with other Templates & Calculators available to download.
Z-distribution (Normal Distribution Table)
Z-Distribution: Areas of the standard normal distribution
The tables assumes the data set is normally distributed and the process is stable.
The z-score = x if the mean is 0 and the standard deviation = 1 which indicates a standard normal distribution.
t-distribution
t-Distribution: Critical values from the t-Distribution
For the t-distribution, dF = n-1, represents the degrees of freedom. If you have 29 samples, then dF = 28.
The t-distribution is used instead of the z-distribution (standard normal distribution) when the:
- Population standard deviation is unknown
- Population is normally distributed
The t-distribution is a series of distributions, a unique distribution exist for each sample size. As the sample size increases it becomes taller and narrower and exhibits more characteristics of the normal curve. Generally applied with sample sizes <30.
Click here to learn more about the t-distribution and t-tests with examples.
F-distribution
F-Distribution: Percentage points of the F-Distribution
NIST table with the most common levels of significance and degrees of freedom.
Chi-Square distribution
The Chi-square distribution is most often used in many cases for the critical regions for hypothesis tests and in determining confidence intervals.
- Chi-square test for independence in an "Row x Column" contingency table
- Chi-square test to determine if the standard deviation of a population is equal to a specified value.
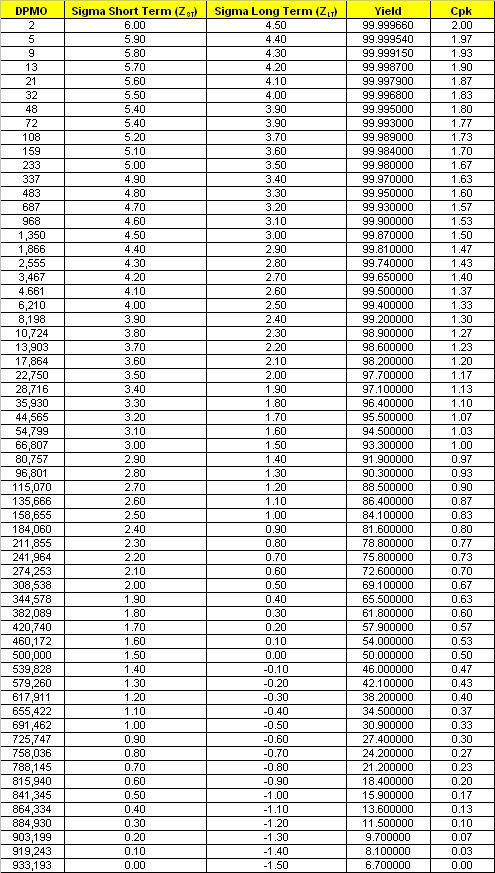
DPMO, Z-Score, Cpk, Yield Conversion Table
Short Term Sigma Conversion Table
Note: Converting a Sigma score to Cpk is only an approximation because Cpk is based only upon the specification limit closest to the process mean (recall the calculation for Cpk has two values). The opposite side of the process distribution, which may have a tail that is much different, is unaccounted for by the Cpk calculation.
Statistical Evaluation Tools
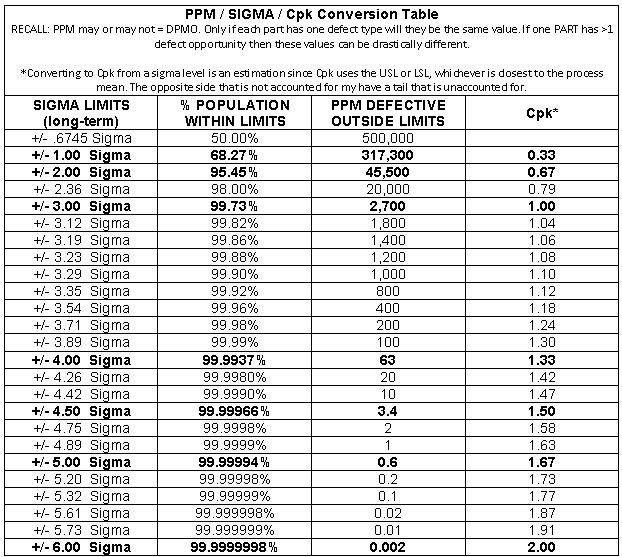
Long Term Sigma / PPM / Cpk Table
The conversion table below is similar to the one above but lets discuss the differences.
It is very important to remember that DPMO and PPM may or may not be the same. Lets use an exaggerated example to illustrate a point.
If ONE part has 1,000,000 opportunities for a defect, and one defect is found that makes the entire PART a defective PART.
So it is possible that you could have 1 PPM with a DPMO of 0.000001.
Also, Cpk is estimated from the sigma level and it isn't always an exact match since the Cpk calculation takes the better of the USL or LSL and doesn't consider the tail of the opposite tail.
It is most important to understand the basic relationships and memorize the most common levels of sigma, estimated Cpk, and yields for normal distributions.
Also, if a process is CENTERED, then Cp = Cpk.
Search active career postings related to Six Sigma
Project Acceleration Techniques
Return to the Six-Sigma-Material Home Page

Site Membership
LEARN MORE
Six Sigma
Templates, Tables & Calculators
Six Sigma Slides
Green Belt Program (1,000+ Slides)
Basic Statistics
Cost of Quality
SPC
Control Charts
Process Mapping
Capability Studies
MSA
SIPOC
Cause & Effect Matrix
FMEA
Multivariate Analysis
Central Limit Theorem
Confidence Intervals
Hypothesis Testing
Normality
T Tests
1-Way ANOVA
Chi-Square
Correlation
Regression
Control Plan
Kaizen
MTBF and MTTR
Project Pitfalls
Error Proofing
Z Scores
OEE
Takt Time
Line Balancing
Yield Metrics
Sampling Methods
Data Classification
Practice Exam
... and more


