ANALYZE
Welcome to the 3rd phase of a DMAIC Project.
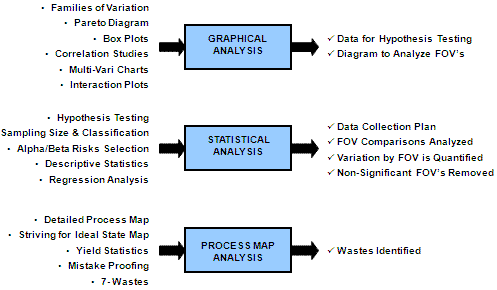
The ANALYZE phase is the beginning of the statistical analysis of the
problem. The practical problem was created earlier. This phase
statistically reviews the families of variation to determine which are
significant contributors to the output.
The statistical analysis
is done beginning with a theory, null hypothesis. The analysis
will "fail to reject" or "reject" the theory.
The families of variation and their contributions are quantified and relationships between variables are shown graphically and numerically to provide the direction for improvements.
For example:
You may analyze part-part variation, shift-shift variation, operator-operator variation, machine-machine variation.
By now the MSA has been accepted and the Study Variation has been quantified. The remaining variation is Process Variation.
Recall that:
TOTAL VARIATION = PROCESS VARIATION + MEASUREMENT SYSTEM VARIATION
Most of the analysis at this phase is not whether the AFTER process performance is different than the BEFORE process performance because none of the improvements have been implemented yet, these improvements are now becoming evident and prioritized.
This phase is about statistically comparing means and variation on all families of variation to drill down and quantitatively explain the critical sources of the dispersion.
By the end of the ANALYZE phase the KPIV's that are creating the most significant effect on "Y" should be identified. Any wastes found by employing Lean tools should be identified and prioritized to improve.
The outputs of ANALYZE lead into the inputs to the IMPROVE phase.
The following links cover topics that are often applied within the ANALYZE phase:
Hypothesis Testing:
Nonparametric Tests & Flowchart
Analyzing the sources of Process Variation:
Statistics:
Alpha and Beta Risks (Type I Error and Type II Error)
Pearson's Correlation Coefficient
Spearman's Rho Correlation Coefficient
Distributions:
Shape of the Distribution:
Lean Manufacturing topics:
Takt Time
Project Management Tools
At this point in the project, and perhaps earlier in the MEASURE phase, there were delays or encounters of adversity. Here are a couple tools as reminders to keep the project on track and charging forward.
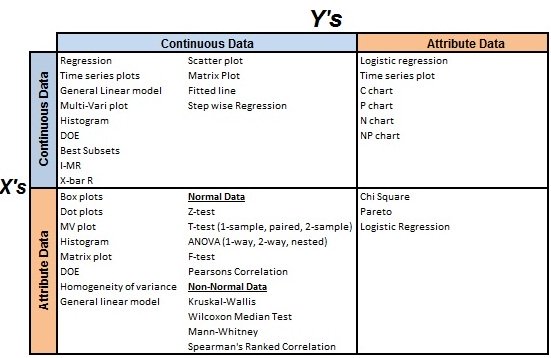
Statistical Evaluation Tools
Return to the beginning of a DMAIC project
Subscribe for a password to access entire site
Return to the Six-Sigma-Material Home page

Site Membership
LEARN MORE
Six Sigma
Templates, Tables & Calculators
Six Sigma Slides
Green Belt Program (1,000+ Slides)
Basic Statistics
Cost of Quality
SPC
Control Charts
Process Mapping
Capability Studies
MSA
SIPOC
Cause & Effect Matrix
FMEA
Multivariate Analysis
Central Limit Theorem
Confidence Intervals
Hypothesis Testing
Normality
T Tests
1-Way ANOVA
Chi-Square
Correlation
Regression
Control Plan
Kaizen
MTBF and MTTR
Project Pitfalls
Error Proofing
Z Scores
OEE
Takt Time
Line Balancing
Yield Metrics
Sampling Methods
Data Classification
Practice Exam
... and more


