Spaghetti Diagram
A spaghetti diagram is a type of process map that represents the visual creation (map) of actual flow. The keyword is ACTUAL, not what it should be or perceived to be. It is a snapshot in time so it may not include all what-if and special scenarios, but these do warrant discussion as the team progresses to suggest improvements.
This is one potential downside because these must be captured for Process Mapping especially if these scenarios are high in risks and costs.
These diagrams are used to track:
- Product Flow
- Paper/Information Flow
- People Flow
Use a different line type or color for each flow type, or use separate map for each flow path for more clarity.
Creating a Spaghetti Diagram should be done with the operators or those that use the process. Record the path with a pencil and use a measuring wheel or tape measure to document distances. You are looking for "cooked spaghetti", not spaghetti directly from the box, things rarely move in straight lines.
GETTING STARTED:
- Overhead views of area, drawn close to scale and labeled
- Colored Pencils
- Measuring Wheel and/or tape measure
- Stop Watch
- Team, Operators, People impacted by the flow
- Actual Process
STEPS:
1) Record the processes on the side and ask questions if not clear on the activity.
2) Start at the beginning of the scope, the start of the first process. Use directional arrows for the routes that are traced on the paper.
3) Do not leave out any flow movement even if the paper becomes cluttered and difficult to follow. This probably indicates opportunity. Most often, the perceived unusual flow, or "exceptions", are actually happening more often that is realized. Capture these!
4) Record the amount of time within each activity.
5) Shows the areas where materials stops, staged, held, inspected and picked up. Look for point-of-use opportunities for materials, tools, and paperwork.
6) Record the names of those involved, dates, times, and other relevant information.
7) Calculate the distance, times, shift, starts, stops, to provide baseline performance.
8) Create a separate diagram showing the ideal state of flow for each that eliminates as much non-value added tasks as possible. The team should target the ideal state and the Project Manager and Champion should remove obstacles that may prevent this objective.
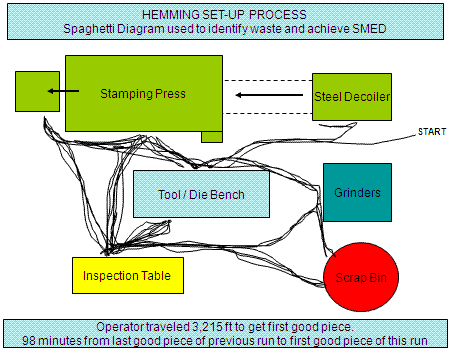
Operator Flow EXAMPLE:
BEFORE
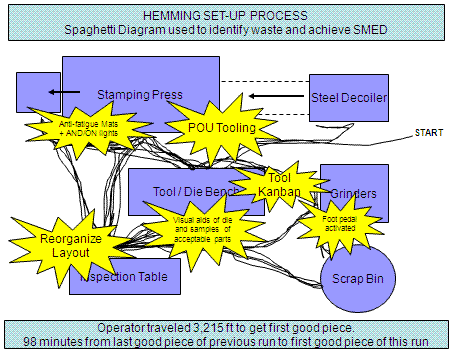
IDEAS to IMPROVE
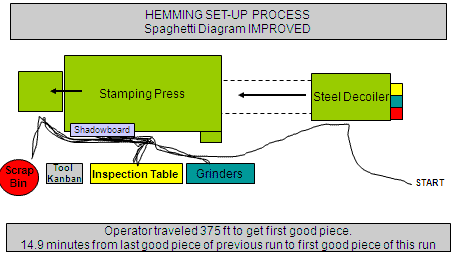
Spaghetti Diagram Improvements (after several inexpensive iterations):
- AND/ON lights to signal for raw material, paperwork, and part removal
- Tooling shadowboard placed at the Point-of-Use
- Repaint all equipment and floor
- New tables fabricated to all have same appearance and color schemes
- Layout reorganized to minimize operator travel
- Foot pedal to allow quicker and safer use of grinder
- Tools prepared and qualified by QC prior to being used
- Inspection equipment upgraded and organized with local task lighting
- Scrap bin placed at machine discharge and analyzed daily
- Anti-fatigue mats placed under primary working area
- Physical samples of good/bad pieces available for each job
- Oil/Water plumbed directly to machine – eliminate travel
- Compressed air line suspended overhead on retractor mechanism
- Visual work instructions on standard set-up procedure
- Sent operators to advanced machinery training at manufacturer
- KANBAN for perishable tools such as pins, grease, and punches
- Dry-erase Production Board to record production, scrap, and downtime
- Relocate inspection closer to operator
- Tugger to bring standard items to and from operator, such as tooling, gloves, and paperwork.
AFTER the IMPROVEMENTS
Set-Up Time Reduced by 85%
Distance walked reduced by ~3,000 ft
Purpose of a Spaghetti Diagram
The idea is to make quick and vigorous improvements to the Spaghetti Diagram with zero tolerance for waste. Keep in mind the machine or station Overall Equipment Effectiveness (OEE) and all the Lean Manufacturing principles and relentlessly work and train to make the improvements.
Try to keep the longer-term action items from interfering with activity and positive momentum. Don't try to achieve the perfect state right away, it won't happen quickly. Get some improvements in place and plan to improve from there.
It may take several iterations before the final layout is determined. Ideas will be generated as changes are being done and results will vary. Execute as many of these changes with little cost and the best quality possible.
Some items may require capital investment and management approval. These should be investigated and submitted if justifiable. Make a note of these outstanding action items with timelines to the project checklist but don't allow them to stall progress.
Put the open action items on an easel or board in the specific area and keep it visible for everyone to see. It is also a good idea to audit the changes, especially until new habits are embedded and gains are proven to be sustained.
In order to make a fundamental improvement to the Spaghetti Diagram, these ideas must be supported by upper management. Doing things the same way gets the same results.
Prepare to change the ways things were done in the past. The team leaders need to prove why change is necessary and what the goal is at the end. It is important the team have autonomy, available resources, and pride to workmanship.
ATTENTION Leaders:
TAKE CARE of your team. Consider bringing in lunch, coffee, refreshments, dinner, certificates of participation, and be creative.
Upper management should be aware of meetings, investments required, changes, and allow team member participation as necessary (or as planned). Pulling team members, deferring events, and changing direction will hinder progress and risk the ability to control the gains. It is the job of the GB/BB to ensure all obstacle within management are removed before embarking on a Kaizen Blitz or Six Sigma project.
Other hints to help expose waste and maintain a cleaner workplace:
- Avoid stickers in manufacturing environments
- Engrave labels and color code visual aids
- Eliminate flat surfaces on tables (tables collect clutter)
- Eliminate unnecessary shelves (also collect clutter)
- Minimize drawers (say it again one more time...clutter)
- Use light colors of paint to expose grease, oil, dirt, leaks
- Local task lighting is cheaper than lighting an entire area
- Do everything practical to keep the operator at machine(s) all the time
- Put items on stands, casters, or legs (easier to clean around)
- Make items portable and standardized for interchangeability
- Use a standard for signage and consistent sign design
- Remove obsolete postings, slogans, mission statements, etc.
DO's and DONT's
DONT's:
- Draw the diagrams the way people think the process flows.
- Make assumptions.
- Start this exercise without commitment for management.
- Ignore any steps.
DO's:
- Involve the operators of process.
- Draw the process the way it actually flows. GEMBA, go see the flow.
- Use different colors to represent various people or machines (forklifts, tuggers)
- Select people who are passionate about the need for eliminating waste.
- Train the people that will be drawing the diagram.
- Prepare (don's scramble for pencils, paper, etc. in the middle of the exercise).
- Record all the steps, regardless if it is an anomaly.
- Try to capture some of the "what-if" routes in your notes. Such as "If this happens, then the operator would have to go to this area for this reason".
Templates, Tables, and Calculators
Certification problems - test your DMAIC knowledge
Return to the Six-Sigma-Material Home Page
Recent Articles
-
Process Capability Indices
Oct 18, 21 09:32 AM
Determing the process capability indices, Pp, Ppk, Cp, Cpk, Cpm -
Six Sigma Calculator, Statistics Tables, and Six Sigma Templates
Sep 14, 21 09:19 AM
Six Sigma Calculators, Statistics Tables, and Six Sigma Templates to make your job easier as a Six Sigma Project Manager -
Six Sigma Templates, Statistics Tables, and Six Sigma Calculators
Aug 16, 21 01:25 PM
Six Sigma Templates, Tables, and Calculators. MTBF, MTTR, A3, EOQ, 5S, 5 WHY, DPMO, FMEA, SIPOC, RTY, DMAIC Contract, OEE, Value Stream Map, Pugh Matrix

Site Membership
LEARN MORE
Six Sigma
Templates, Tables & Calculators
Six Sigma Slides
Green Belt Program (1,000+ Slides)
Basic Statistics
Cost of Quality
SPC
Control Charts
Process Mapping
Capability Studies
MSA
SIPOC
Cause & Effect Matrix
FMEA
Multivariate Analysis
Central Limit Theorem
Confidence Intervals
Hypothesis Testing
Normality
T Tests
1-Way ANOVA
Chi-Square
Correlation
Regression
Control Plan
Kaizen
MTBF and MTTR
Project Pitfalls
Error Proofing
Z Scores
OEE
Takt Time
Line Balancing
Yield Metrics
Sampling Methods
Data Classification
Practice Exam
... and more


