Degrees of Freedom (dF)
Objective:
The term Degrees of Freedom (dF) is used in statistics to calculate the number of measurements that are needed to make an unbiased estimate of a statistic. It is the number of independent pieces of information available to estimate a statistic. Also defined as the number of values that may vary in the final calculation of a statistic.
An "unbiased estimate" is when the mean of the sampling distribution of a statistic can be shown to equal the (population) parameter being estimated.
The more degrees of freedom, the lower the uncertainty in your results....which is similar to the sample size (the more samples, the more representative of the population, thus less uncertainty in your results). Therefore, dF and 'sample size' are not equal but they are related.
The dF characterize the uncertainty in the estimated sigma which determines the amount of uncertainty in calculated control limits.
The dF is represented by the lowercase Greek letter nu (v).
dF = n - x
where n is the sample size or observations and x is number of parameters to be estimated.
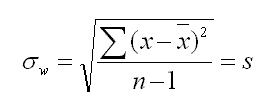
An example of a "parameter to be estimated" is the sample mean when calculating the sample standard deviation as shown below.
A simple way to generalize it is as the number of samples minus the number of calculated (estimated) parameters.
The dF in this case is equal to n-1 since only the sample mean is being estimated. In other words, the sample variance contains n-1 degrees of freedom. There a "n" random values minus the sample mean which is estimated.
dF formulas:
dF = n-1 when using the Paired t-test and 1-Sample t test.
dF = n1 + n2 - 2 when using the 2-Sample t test with assumed equal variances
dF = (# of Rows - 1) * (# of Columns - 1) when using chi-square tests
Notation:
There are a few variations used to denote degrees of freedom:
v = lower case Greek letter nu which is most commonly found in equations
n = however this is more often applied to represent sample size
d.f. or dF
Practice Problem
The chi-square test is being used to analyze the results of an experiment which had 6 treatments and each treatment was categorized as one of two options, PASS or FAIL.
How many degrees of freedom are used to compare calculated chi-square and tabulated chi-square values?
Answer:
dF = (# of Rows - 1) * (# of Columns - 1)
dF = (2-1) * (6-1) = 1 * 5 = 5
Templates, Tables, and Calculators
Return to the Six-Sigma-Material Home Page

Site Membership
LEARN MORE
Six Sigma
Templates, Tables & Calculators
Six Sigma Slides
Green Belt Program (1,000+ Slides)
Basic Statistics
Cost of Quality
SPC
Control Charts
Process Mapping
Capability Studies
MSA
SIPOC
Cause & Effect Matrix
FMEA
Multivariate Analysis
Central Limit Theorem
Confidence Intervals
Hypothesis Testing
Normality
T Tests
1-Way ANOVA
Chi-Square
Correlation
Regression
Control Plan
Kaizen
MTBF and MTTR
Project Pitfalls
Error Proofing
Z Scores
OEE
Takt Time
Line Balancing
Yield Metrics
Sampling Methods
Data Classification
Practice Exam
... and more


