Correlation Matrix
or Prioritization Matrix
Description:
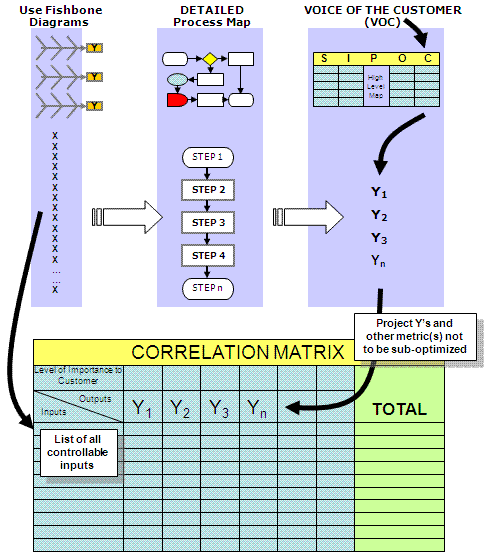
The Correlation Matrix is the second subjective screening tool to filter out lesser important process inputs from the key process input variable (KPIV's).
The completion of the Fishbone Diagrams or another method of identifying all inputs to the problem is a prerequisite to this step.
Objective:
To screen the numerous input variables by subjective analysis using the team's knowledge and supporting data by weighing each according to their correlation to impact on the problem.
The figure below shows the linkage of the commonly used subjective tools.
The following steps should occur for each INPUT:
- Briefly discuss the input and its meaning so each appraiser understands.
- Weigh the input, as it correlates to each Y, using the weighting scale the team has established.
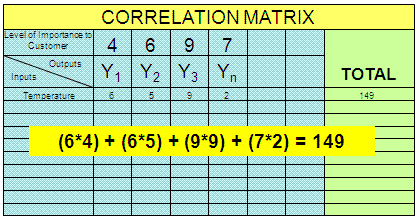
- Compute the total score for each input. Sample calculation shown below.
- Sort the input scores in descending order.
- Determine cut-off point and carry these inputs to the FMEA for risk analysis.
Before assigning weights, it is important to have a brief (emphasize "brief") overview and discussion of the "input" so everyone understands why it was identified as a root cause in the first place. This will help to get a better decision on the weighting by each person as it correlates to the problem.
The cut-off point may be a certain score and higher OR the team may decide to focus on targeting a specific section of the detailed process map where most of the highest scores exist. There aren't specific criteria.
Each score is relative to the other scores. This tool will shed light on what the cross functional team thinks are the most important inputs to improve and control that will lead to a closure in the project gap according to the contract.
Example Calculation
Shown below is a sample calculation for one input, "Temperature'. A spreadsheet can be created to automate and sort the steps shown above.
Completion of this tool must be used with a solid plan to keep it
quickly progressing. It can take very long time to complete if
there is not a plan to weigh each input. This is normally done in
a room with everyone on the team present for cross-functional
representation.
For instance, if there are 50 unique controllable
inputs identified from the Fishbone Diagrams and there are 4 project
Y's, then there will be 200 appraisals. And if there are six people
weighing in on each of those 600 scores, it can take a very long time.
There should be a quick vote, and the Process Owner should make the final call on the score if there are ties or disagreements.
Sometimes,
a column is added to indicate the EASE OF COMPLETION. Therefore, if
the input gets a lower overall score but is very easy to resolve and
complete, then it should be targeted and improved as part of the IMPROVE
phase. These do not necessarily have to be taken to the FMEA for risk
analysis.
The subjective screening tools of the Fishbone Diagram
through the FMEA are usually done at the same time the MSA is being
completed. The MSA is more related to the GB/BB and a couple members of
the team, but the subjective screening tools require as much of the team
as possible.
Correlation Matrix Template
|
A Correlation Matrix template is available here. Plug in the x's and y's along with the weights and begin adding scores. The totals are calculated and then sort by the highest scores to see the inputs that the team subjectively determined to have the most impact on the project. |
Proceed to the next screening tool: FMEA
Return to the MEASURE phase
Templates, Tables, and Calculators
Subscribe for full site access
Return to the Six-Sigma-Material Home Page
Recent Articles
-
Process Capability Indices
Oct 18, 21 09:32 AM
Determing the process capability indices, Pp, Ppk, Cp, Cpk, Cpm -
Six Sigma Calculator, Statistics Tables, and Six Sigma Templates
Sep 14, 21 09:19 AM
Six Sigma Calculators, Statistics Tables, and Six Sigma Templates to make your job easier as a Six Sigma Project Manager -
Six Sigma Templates, Statistics Tables, and Six Sigma Calculators
Aug 16, 21 01:25 PM
Six Sigma Templates, Tables, and Calculators. MTBF, MTTR, A3, EOQ, 5S, 5 WHY, DPMO, FMEA, SIPOC, RTY, DMAIC Contract, OEE, Value Stream Map, Pugh Matrix

Site Membership
LEARN MORE
Six Sigma
Templates, Tables & Calculators
Six Sigma Slides
Green Belt Program (1,000+ Slides)
Basic Statistics
Cost of Quality
SPC
Control Charts
Process Mapping
Capability Studies
MSA
SIPOC
Cause & Effect Matrix
FMEA
Multivariate Analysis
Central Limit Theorem
Confidence Intervals
Hypothesis Testing
Normality
T Tests
1-Way ANOVA
Chi-Square
Correlation
Regression
Control Plan
Kaizen
MTBF and MTTR
Project Pitfalls
Error Proofing
Z Scores
OEE
Takt Time
Line Balancing
Yield Metrics
Sampling Methods
Data Classification
Practice Exam
... and more


