Binomial Distribution
The binomial distribution is a discrete distribution displaying data that has only TWO OUTCOMES and each trial includes replacement. The binomial distribution approaches a normal distribution as the sample size increases; therefore, this approximation is better for larger sample sizes.
Example are options such as:
- PASS / FAIL
- GO / NO-GO
- SUCCESS / FAILURE
- IN / OUT
- YES / NO
- HOT / COLD
- MALE / FEMALE
- WORKS / DOESN'T WORK
- DEFECTIVE / NOT DEFECTIVE
- RIGHT-HANDED / LEFT-HANDED
- HIGH / LOW
- CORRECT / INCORRECT
- HEADS / TAILS
Assumptions
- Each trial has only two outcomes
- The experiment has n identical trials
- Each trial is independent of the other trials
- The probability of getting one outcome (success) p is held constant and the probability of getting the other outcome (failure) is also held constant, represented by (1 - p) also referred to as q.
- Includes replacement for each trial. It can be used to approximate without replacement trials but it is suggested to use hypergeometric distribution formulas.
Let's evaluate the assumptions:
A coin flip is an example of two outcomes and each flip has the same chance for both outcomes (meaning independent). Flipping the coin n amount of times means there are n identical and independent trials. Nothing changes from one flip to another and the odds are the same for each flip.
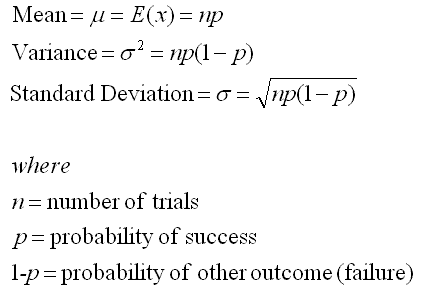
The following formula is used to compute the number of experimental outcomes resulting from x successes in n trials.

For example: 4! (4 factorial) = 4*3*2*1 = 24
The Binomial Distribution Probability Function is shown below:

Binomial Distribution Example
A manufacturing process creates 3.4% defective parts.
A sample of 10 parts from the production process is randomly selected. What is
the probability that the sample contains exactly 3 defective parts?
SOLUTION:
There are two outcomes: Defective / Not-Defective, therefore the Binomial Distribution equation is applied.
p = 0.034 (which is 3.4%)
n = 10 samples
then q = 1-p = 1 - 0.034 = 0.966 (which is 96.6%)
Need the probability that x = 3.
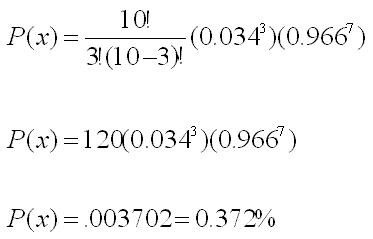
Substitute the values into the Binomial Probability Function and solve:
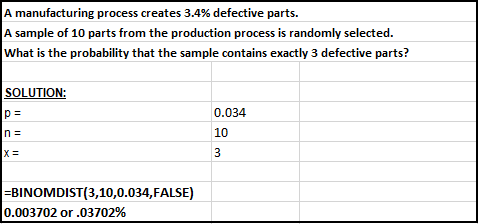
The picture below shows how to solve the problem using Excel
Example Two
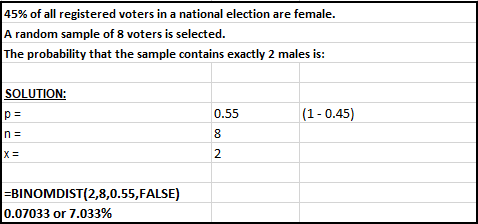
45% of all registered voters in a
national election are female. A random sample of 8 voters is selected.
The probability that the sample contains exactly 2 males is:
SOLUTION:
55% are male and there are two outcomes: MALE / FEMALE
n = 8
p = 0.55 (55%)
q = 1-p = 0.45 (45%)
Need the probability that x = 2
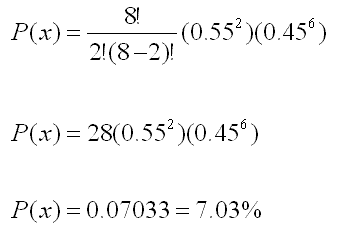
The picture below shows how to solve the problem using Excel
Example Three
79% percent of the students of a large class passed
the final exam. A random sample of 4 students are selected to be
analyzed by the school. What is the probability that the sample contains
fewer than 2 students that passed the exam?
There are two outcomes: PASS / FAIL
p = 0.79
n = 4
Solving for the probability that x < 2.
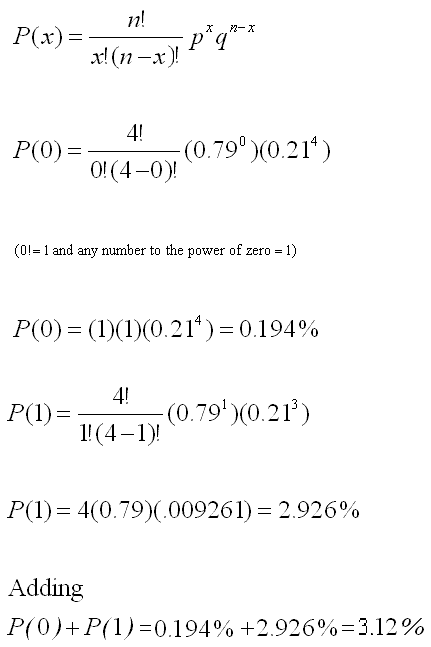
Note that we need to compute p(x<2). So, it is necessary to add the P(x=0) to the P(x=1).
Each P(x=0) and P(x=1) must be calculated separately and added.
p(x<2) = p(x=0) + p(x=1)
Substitute the following values into the binomial equation to find p(x=0):
n = 4
p = 0.79
q = 1 - p = 1 - 0.79 = 0.21
x = 0
PLUS
n = 4
p = 0.79
q = 1 - p = 1 - 0.79 = 0.21
x = 1
The picture below shows how to solve the problem using Excel
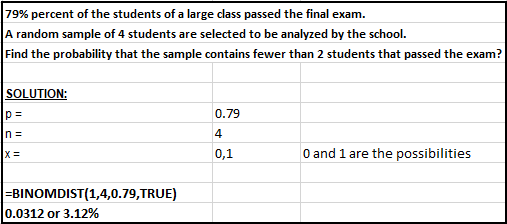
There is 3.12% chance of selecting fewer than 2 (in other words, 0 or 1 student) students that passed the
exam when randomly selecting 4 students when 79% of them passed.
There are also Binomial tables that can be used when the input variables are known (and found within the table).
Application of the Binomial Distribution
Search current job openings related to Six Sigma
Return to the Six-Sigma-Material Home Page
Recent Articles
-
Process Capability Indices
Oct 18, 21 09:32 AM
Determing the process capability indices, Pp, Ppk, Cp, Cpk, Cpm -
Six Sigma Calculator, Statistics Tables, and Six Sigma Templates
Sep 14, 21 09:19 AM
Six Sigma Calculators, Statistics Tables, and Six Sigma Templates to make your job easier as a Six Sigma Project Manager -
Six Sigma Templates, Statistics Tables, and Six Sigma Calculators
Aug 16, 21 01:25 PM
Six Sigma Templates, Tables, and Calculators. MTBF, MTTR, A3, EOQ, 5S, 5 WHY, DPMO, FMEA, SIPOC, RTY, DMAIC Contract, OEE, Value Stream Map, Pugh Matrix

Site Membership
LEARN MORE
Six Sigma
Templates, Tables & Calculators
Six Sigma Slides
Green Belt Program (1,000+ Slides)
Basic Statistics
Cost of Quality
SPC
Process Mapping
Capability Studies
MSA
SIPOC
Cause & Effect Matrix
FMEA
Multivariate Analysis
Central Limit Theorem
Confidence Intervals
Hypothesis Testing
T Tests
1-Way ANOVA
Chi-Square
Correlation
Regression
Control Plan
Kaizen
MTBF and MTTR
Project Pitfalls
Error Proofing
Z Scores
OEE
Takt Time
Line Balancing
Yield Metrics
Sampling Methods
Data Classification
Practice Exam
... and more
Need a Gantt Chart?


