Affinity Diagram
Description:
The Affinity Diagram is a quality management tool used for Project Management. A Six Sigma Green or Black Belt most often use this tool in DFSS projects or in the MEASURE phase of a Six Sigma DMAIC project. It's designed to invoke creative thinking and organize qualitative information into related topics. It is the easiest and least complex modern quality tool to begin the problem-solving journey.
The Affinity Diagram is used for new, complex, or unfamiliar problems but not mathematical or structured problems. It is easy to use and can get the team moving forward together by bringing out each person's input, thoughts, and questions.
By breaking down large amounts of data and visualizing in
groups makes it is easier for the team to understand and analyze. Trying to
interpret everything at one time going from one topic to another can be chaotic
and inefficient.
Objective:
It is often used to analyze feedback from the Voice
of the Customer findings. There may be several customers that have
feedback related to one topic and others that have feedback on others. This
tool allows them to be grouped and studied by topic. This can also be used at
any time to organize a broad set of issues or opinions.
As with using most tools, using the Affinity Diagram begins with educating the team on the use and purpose of the tool.
It is a brainstorming, mind-mapping, and then grouping technique that organizes ideas according to their affinity (similarity). This does not involve and quantitative analysis or ranking. Credit is given to Jiro Kawakita for development of this tool in the 1960's. Therefore, the Affinity Diagram is also referred to as The KJ Method (not JK).
Other grouping techniques include the interrelationship
diagram and the Ishakawa Diagram, or Fishbone Diagram, which is used in the
MEASURE phase.
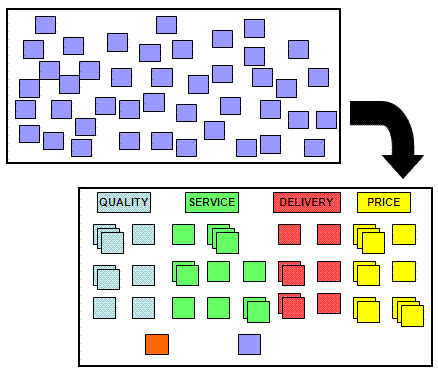
A large number of ideas from all team members are written in
silence or as group session and posted on a board or otherwise gathered.
Commonly, teams use notes and stick them to a board and they are moved around
into their respective categories as discussion takes place.
Once all notes are complete and gathered, the leader should
discuss each one briefly but enough so everyone understands it and can agree to
which topic or category to locate it in.
It is often that team members disagree on which topic to
place the note(s), many could fall in two or more categories. Make a copy of
the note and put in more than one category.
Topics include part, machine, delivery, quality,
form, tools, service, cost and the list can go on almost infinitely depending on the project.
Once the notes are organized into the general topics, it may
be desirable to break down the topic further. This is helpful when the topic is
very general and/or there are many notes on one topic, and they are not closely
related.
Many notes or statements may be identical, keep them all and
cluster them together under the related topic. There may be miscellaneous notes
that don't fall into one specific category. Group them together or
individually, ensure to value them as well as the others.
There are seven common Project Management tools that Six Sigma project managers should be familiar with:
1) Matrix Diagram
2) Tree Diagram
3) Process Decision Program Chart (PDPC)
5) Interrelationship Diagram (ID)
6) Affinity Diagram
7) Prioritization Matrix, (also used in the MEASURE phase
Practice Exam Question
Rank these quality management tools from least complex to most complex:
1) PDPC Chart
2) Affinity Diagram
3) Matrix Diagrams
4) Priority Matrix
Answer: 2,1,3,4
A Tree Diagram is similar in complexity to the PDPC Chart.
Test your knowledge with over 180 practice exam questions similar to this. Get a Practice Test here.
Templates, Statistics Tables, and Calculators
Return to the Six-Sigma-Material Home Page
Recent Articles
-
Process Capability Indices
Oct 18, 21 09:32 AM
Determing the process capability indices, Pp, Ppk, Cp, Cpk, Cpm -
Six Sigma Calculator, Statistics Tables, and Six Sigma Templates
Sep 14, 21 09:19 AM
Six Sigma Calculators, Statistics Tables, and Six Sigma Templates to make your job easier as a Six Sigma Project Manager -
Six Sigma Templates, Statistics Tables, and Six Sigma Calculators
Aug 16, 21 01:25 PM
Six Sigma Templates, Tables, and Calculators. MTBF, MTTR, A3, EOQ, 5S, 5 WHY, DPMO, FMEA, SIPOC, RTY, DMAIC Contract, OEE, Value Stream Map, Pugh Matrix

Site Membership
LEARN MORE
Six Sigma
Templates, Tables & Calculators
Six Sigma Slides
Green Belt Program (1,000+ Slides)
Basic Statistics
Cost of Quality
SPC
Process Mapping
Capability Studies
MSA
SIPOC
Cause & Effect Matrix
FMEA
Multivariate Analysis
Central Limit Theorem
Confidence Intervals
Hypothesis Testing
T Tests
1-Way ANOVA
Chi-Square
Correlation
Regression
Control Plan
Kaizen
MTBF and MTTR
Project Pitfalls
Error Proofing
Z Scores
OEE
Takt Time
Line Balancing
Yield Metrics
Sampling Methods
Data Classification
Practice Exam
... and more
Need a Gantt Chart?
