Defects per Opportunity (DPO)
Defects per Opportunity is the probability of units produced with zero defects by the process. One part (or unit) may have as low as one opportunity for a defect or it may have infinite opportunities for defects.
A complex stamping for an airplane fuselage may have hundreds of characteristics that can each be defective. If any one of those characteristics is out of specification (aka there is a defect) then the unit is considered defective. A simpler product such as nail will have fewer opportunities. Measurable opportunities are considered.
Given:
D: # of defects
O: # of opportunities for a defect
U: # of units
TOP: Total number of opportunities = U * O
Formula:

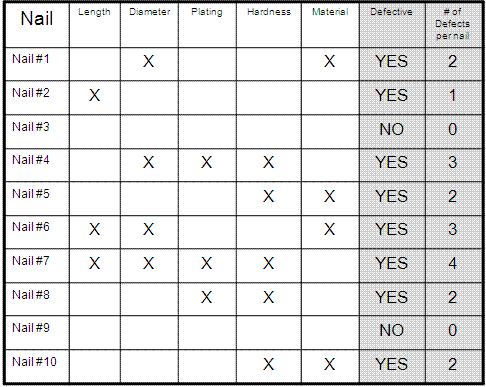
Examine the table shown below:
D = 19 defects
O = 5 opportunities
U = 10 nails
TOP = 50 total opportunities
DPU = 1.9 defects per unit
DPO = 0.38 defects per opportunity.
Each opportunity (length, diameter, plating, hardness, material) has an average of 0.38 defects in each nail.
Additional Note:
Notice below that only 2 nails of the 10 total nails were completely defect-free and 8 of the nails were defective....meaning that each of the 8 nails had at least one type of defect. That means the PPM is 8/10 or 800,000.
DPMO and PPM can be different values. Click here to learn more.

Other similar metrics
Several metrics are related such as the following below. You should be able to calculate all of them as preparation for a Six Sigma certification exam.
TOP - Total Opportunities
DPU - Defects Per Unit
DPMO - Defects Per Million Opportunities
Click here to get a DPMO and Six Sigma Calculator that also computes DPO and DPU and allows you to analyze various scenarios and the impact on the metrics.
Templates, Tables, and Calculators
Site Membership
Click for a Password
to access entire site
Six Sigma
Templates & Calculators
Six Sigma Modules
The following are available
Click Here
Green Belt Program (1,000+ Slides)
Basic Statistics
Cost of Quality
SPC
Process Mapping
Capability Studies
MSA
Cause & Effect Matrix
FMEA
Multivariate Analysis
Central Limit Theorem
Confidence Intervals
Hypothesis Testing
T Tests
1-Way ANOVA
Chi-Square
Correlation and Regression
Control Plan
Kaizen
MTBF and MTTR
Project Pitfalls
Error Proofing
Effective Meetings
OEE
Takt Time
Line Balancing
Practice Exam
... and more


