CTQ Linkage
Description:
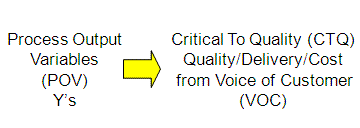
The CTQ linkage is a graphical depiction showing a clear link to the needs that are Critical to Quality (CTQ) from the perception of the customer. The chart is used in the DEFINE phase and begins with the most elementary needs and more levels are added as needed and exact metrics are not necessary at this time.
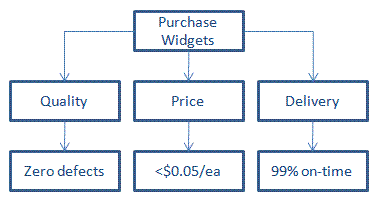
The CTQ breaks down customer requirements into the customer needs, customer drivers, and potential quality metrics. This tree can translate customer requirements into quantifiable requirements.
The customer is also the company you are representing and consideration to their requirements (ROI, cash, time schedule) is also important. Below is a very basic form of a CTQ Flowdown.
Objective:
Solidify the connection between the targeted metrics to achieve customer satisfaction by mapping them to the Voice of the Customer (VOC).
The customer can also be the business itself, machine operators, and other stakeholders related to the business, not just the end users that are usually the thought of "customers". This can be referred to as the Voice of the Business.
The intent is to take the often broad or vague customer requirements and drill them down into specific, quantifiable, and measurable requirements. As the "tree" grows (downward) the requirements become more specific and granular.
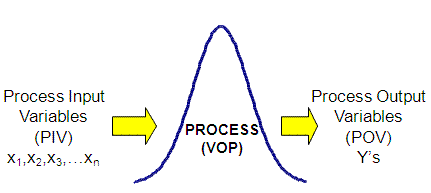
All of the inputs impact the process. The inputs of the process create an output, "Y". The goal is to have "Y" linked to the needs and expectations of the customer. Customer needs are in the areas of cost, delivery quality, service, and more.
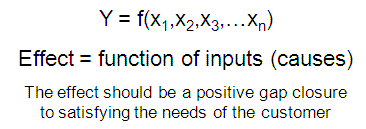
The Voice of the Process (VOP) is described by the Process Output Variables (POV). The VOP is a function of all the inputs:
The causes are the x's (or inputs) and are often first captured on the Fishbone Diangram. These inputs create a process output. The Six Sigma project strives to improve toward a more desirable target and reduce it's variation (make it more consistent). These improvements must be directly linked to the critical needs of the customer.
These needs are labeled as the those being Critical to Quality, however, this pertains to any type of customer need and specification.
FOCUS ON the customer must-haves and needs before trying to implement delighter and surprise features or spending excess resources and money to achieve unnecessary levels of performance.

Basic Dimensions of Quality
There are nine basic dimensions of quality (as considered by many quality gurus). They are as follows but in no particular order of importance:
- Features
- Reputation
- Reliability
- Aesthetics
- Conformance
- Service
- Response
- Durability
- Performance
A question about these nine dimension has been known to come up as a question in past Six Sigma certification exams in the DEFINE section.
The Strategy behind Six Sigma
A customer may have high occurrence rate of defects that involve a part being too long and out of specification. The customer specifies a maximum length of 125mm +/- 5mm (this is the Voice of the Customer (VOC) stating the LSL is 120mm and the USL is 130mm)
The output "Y" is the length.
The Six Sigma team is dedicated to finding the inputs, and their effect, that affect the length of the part. The inputs are the x's.
The length of the part "Y" is a function of several inputs or x's.
- Part Length = function of (x1,x2,x3,....xn)
Some examples of factors that affect the length could be the machine, methods, measurement system, material, and manpower and a further drill down into those areas will get deeper into the sources.
The strategy is to find the most critical inputs and determine the root causes to control so that the process creates the length as close to the target every time; but most of all with minimal variation from part-to-part. Once it is accurate and precise, put controls in the process so it is repeatable and reproducible.
All this must be accomplished by team while maintaining the other metrics that are Critical to Quality or to satisfy the Voice of the Customer (such as on-time delivery and price).
The goal is to have the VOP (Voice of the Process) meet or exceed the VOC (Voice of the Customer).
Return to the DEFINE Phase
Return to DFSS
Site Membership
Click for a Password
to access entire site
Six Sigma
Templates & Calculators
Six Sigma Modules
The following are available
Click Here
Green Belt Program (1,000+ Slides)
Basic Statistics
Cost of Quality
SPC
Process Mapping
Capability Studies
MSA
Cause & Effect Matrix
FMEA
Multivariate Analysis
Central Limit Theorem
Confidence Intervals
Hypothesis Testing
T Tests
1-Way ANOVA
Chi-Square
Correlation and Regression
Control Plan
Kaizen
MTBF and MTTR
Project Pitfalls
Error Proofing
Effective Meetings
OEE
Takt Time
Line Balancing
Practice Exam
... and more


