The probability of having a defect in Process 1:
P(1) = 1 – TPY
Simply says that 100% minus the % of not having a defect from either scrap or rework in ONLY Process 1 is the probably of having a defect.
P(1) = 1 – 0.80 = .20 = 20%
Z-table for 0.20 is approximately 0.84 sigma. This is considered a long term sigma value.
For an entire series of processes use the RTY in place of TPY above. The probability of having a defect in the entire series is:
P(All) = 1 – RTY = 1 – 0.475 = 0.525 = 52.5%
z-table for 0.525 is less than 0 sigma, long term which indicates over half will be defective.
A negative sigma value means that most of the process is performing outside your customer's specification range (LSL and USL).
Using Excel to calculate DPMO and Sigma
There are a couple commonly used Microsoft Excel functions that convert Defects per Million Opportunities (DPMO) to a process sigma (z-score) and vice versa.
To convert from DPMO to process sigma:
Process Sigma = NORMSINV * ( 1 - ( DPMO / 1,000,000)) + 1.5
To convert from process sigma to DPMO:
DPMO = 1,000,000 * ( 1 - ( NORMSDIST * (process sigma - 1.5 ))
CAUTION:
The 1.5 shift is subjective, but some experts use this as conversion from long to short term performance estimates (and vice versa).
NOTE:
A Six Sigma process refers to the process short-term performance or how it is performing currently. When referring to DPMO of the process, we are referring to long-term or projected performance behavior.
A six sigma level of performance has 3.4 defects per million opportunities (3.4 DPMO). A current six sigma process now will have a estimated shift of 1.5 sigma (lower) in the future and will perform at a 4.5 sigma level, which produces 3.4 DPMO.
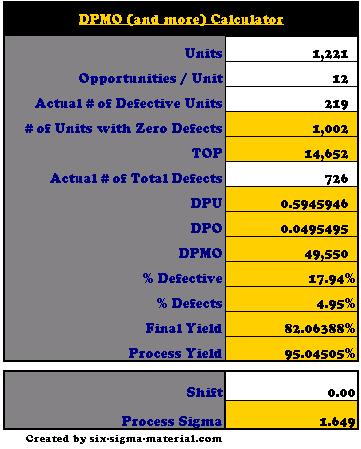
Six Sigma Calculator
Example of z-distribution
What is the probability that Z is greater than or equal to -1.96 and smaller than or equal to -1.4?
Consider that Z is a standard normal random variable.
ANSWER: 0.0558
Use the Z-table to help solve.
Templates, Tables, and Calculators
Return to the Six-Sigma-Material Home Page
Site Membership
Click for a Password
to access entire site
Six Sigma
Templates & Calculators
Six Sigma Modules
The following are available
Click Here
Green Belt Program (1,000+ Slides)
Basic Statistics
Cost of Quality
SPC
Process Mapping
Capability Studies
MSA
Cause & Effect Matrix
FMEA
Multivariate Analysis
Central Limit Theorem
Confidence Intervals
Hypothesis Testing
T Tests
1-Way ANOVA
Chi-Square
Correlation and Regression
Control Plan
Kaizen
MTBF and MTTR
Project Pitfalls
Error Proofing
Effective Meetings
OEE
Takt Time
Line Balancing
Practice Exam
... and more


