Rolled Throughput Yield (RTY)
Rolled Throughput Yield (RTY) is the probability of the entire process producing zero defects. This metric is increasingly relevant when a process has excessive rework.
RTY accounts for rejects (scrap) and rework
Rework is considered the hidden factory costs. A RTY measurement has the advantage of showing the losses related to high defect and/or rework cases across multiple processes.
Since this rework involves many of the 7-wastes and contains the hidden factory opportunity, it is relevant to guide the team in the right direction.
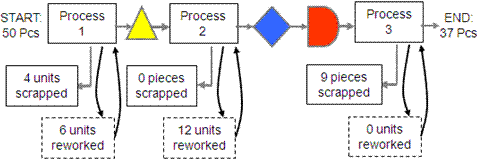
RTY for processes that are in series (one after another) is the product of each process’s throughput yield, TPY. Using the same process as shown below as in the TPY example:
Calculation from above example (assuming one defect makes a defective unit which must be scrapped or reworked):
RTY = Process 1 TPY * Process 2 TPY * Process 3 TPY
RTY = 40/50 * 34/46 * 37/46
RTY = 0.8000 * 0.7391 * 0.8043
RTY = 0.476 = 47.6%
There is a 47.6% chance of the entire process producing zero defects or rework cases.
Review:
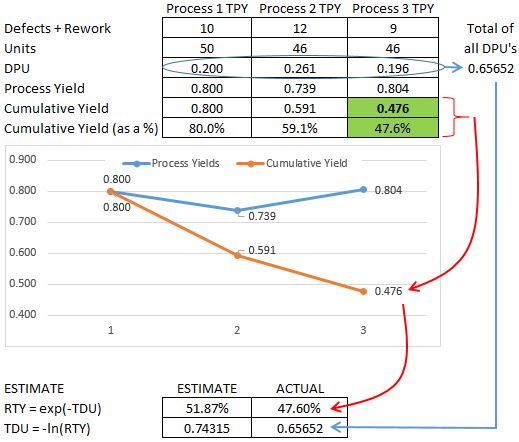
Process 1: There were 50 units that entered Process 1 and 40 of them were neither reworked or scrapped. This means 40 of the 50 went through Process 1 without a defect which = 80%.
OR an estimate can be done (works best when DPU is very small)
DPU = 10 defects among 50 units = 0.2 DPU
thus TPY = e(-DPU) = e(-0.2) = 0.8187 = 82%
Notice this DPU is "large" and therefore this estimate of 82% is off from the true value of 80%.
But if you are only given the DPU for a process (without any other numbers such as the quantity in, scrapped, and reworked), then you can only use this estimate to obtain TPY and thus RTY.
Process 2: There were 46 units that entered Process 2 and none were scrapped but 12 were reworked. This means 34 of the 46 went through Process 2 without a defect = 73.9%
OR an estimate can be done
DPU = 12 defects among 46 incoming units = 0.26087
thus TPY = e(-DPU) = e(-0.26087) = 0.7704 = 77%
Again, this DPU is even higher than Process 1 so expect the TPY estimate to be further off from the actual value of 73.91%
Process 3: There were 46 units that entered Process 3 and 9 were scrapped and none were reworked. This means 37 of the 46 went through without a defect = 80.4%.
OR an estimate can be done
DPU = 9 defects among 46 incoming units = 0.19565
thus TPY = e(-DPU) = e(-0.19565) = 0.8223 = 82%
Again, this DPU estimate is off from the true value of 80.43%.
REVIEW OF CALCULATING RTY
Multiply the TPY for each process and this becomes RTY for the entire process.
Using actual values as shown above the RTY = 47.6 = 48%
Using the DPU estimate method = 0.82 *0.77 * 0.82 = 52%
Notice a 4% approximate difference (learn more below).
CAUTION:
At the end of the entire process there are 37 units left of the original 50 units. The RTY is not 37/50 = 74% because that value of 74% only accounts for scrapped units and not the reworked units.
Once the reworked units are incorporated into the calculation at each step does the RTY become accurate. This emphasizes the importance of including the reworked units, especially if the rework is very costly or near the cost of scrapping a unit.
If the rework cost is very low relative to a scrapped unit, then the incorporation of rework figures is reduced in its importance.
Another shortcut that does not work is to add all the reworked units + scrapped units across all the processes and divide by the starting quantity. A total of 18 units reworked + 13 scrapped = 31 and some would think that 19 must have gone through without a defect. That does not equate to the correct Rolled Throughput Yield.
In this case it would give an answer of 19/50 = 38% which is not correct.
EACH process has its own numerator and denominator that is dependent on the previous process so take each process in order and calculate as shown above.
Using the figures in the example above example see the ESTIMATES vs. ACTUAL below. Notice that the ESTIMATES are higher than the ACTUALS.
 RTY Example at Six-Sigma-Material.com
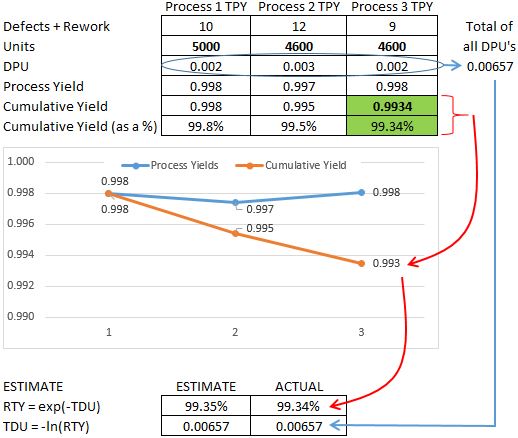
Now, let's change the DPU to a much lower value for each process.
Notice that the ESTIMATES are very close to the ACTUALS (we have increased the units to show a much lower DPU in each process).
 RTY approximation example at Six-Sigma-Material.com
More on Rolled Throughput Yield Formulas
Another formula is shown below to estimate RTY or TDU if the defects per unit or defects and units are known. TDU = Total Defects Per Unit.
This is an ESTIMATE. As mentioned earlier, the ESTIMATES becomes more accurate to match the ACTUALS as the DPU decreases. Notice the two examples below.
RTY and other yield metrics can serve as baseline scores (MEASURE Phase) and final scores for Six Sigma projects (CONTROL Phase).
The baseline score provided in the MEASURE phase does not have to be a z-score and often the yield metrics are easier for team and other company employees to relate with and understand.
But it is possible to take attribute data (such as DPU, DPO, and DMPO) and convert it to a z-score. Click here to see an example in the z-score module.
RTY Template and Calculator
|
Click here for a template that calculates RTY (for processes that are in series) and other yield metrics. There are also a variety of other templates to a Six Sigma Project Manager.
|
Another RTY example
A 3-step process has the following yields and this is the only information you are provided:
Y1 = 98.7%, Y2 = 99.4%, Y3 = 97.8%
What is the Total Defects Per Unit (TDPU)?
This is a two step problem. First find the RTY:
RTY = 0.987 * 0.994 * 0.978 = 0.959494
Recall the TDPU = -ln (RTY)
Therefore, the TDPU = -ln (0.959494) = 0.041
Other YIELD calculations
Final Yield, FY.
Throughput Yield, TPY.
Normalized Yield, NY.
Site Membership
Click for a Password
to access entire site
Six Sigma
Templates & Calculators
Six Sigma Modules
The following are available
Click Here
Green Belt Program (1,000+ Slides)
Basic Statistics
Cost of Quality
SPC
Process Mapping
Capability Studies
MSA
Cause & Effect Matrix
FMEA
Multivariate Analysis
Central Limit Theorem
Confidence Intervals
Hypothesis Testing
T Tests
1-Way ANOVA
Chi-Square
Correlation and Regression
Control Plan
Kaizen
MTBF and MTTR
Project Pitfalls
Error Proofing
Effective Meetings
OEE
Takt Time
Line Balancing
Practice Exam
... and more


