Poisson Distribution
The Poisson Distribution is a discrete distribution named after French mathematician Simeon-Denis Poisson.
Unlike the Binomial Distribution that has only two possible outcomes as a success or fail, this distribution focuses on the number of discrete occurrences over a defined interval. It is used to estimate the probabilities of events that occur randomly per some unit of measure.
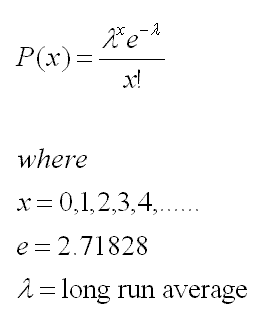
This formula describes rare events and is referred to as the law of improbable events. The formula shown below calculates the probability of occurrences over an interval.
It can provide an approximation to the Binomial Distribution if the number of samples (n) is large and probability of a success (p) is small.

The Poisson distribution exhibits the following:
The Poisson Distribution may apply when studying the:
Notice the word "per" in each of the above statements.
Relationship to Exponential Distribution
A random variable that has a Poisson distribution must have a probability, p, of occurrence that is proportional to the interval length. The number of occurrences in an interval must also be independent events.
Both the Poisson distribution and Exponential distribution are used to to model rates but the latter is used when the data type is continuous.
The Exponential distribution has a Poisson distribution when the:
- event can occur more than 1 time
- time between two successive occurrences is exponentially distributed
- events are independent of previous occurrences
If the random variable, x, has an Exponential distribution then the reciprocal (1/x) has a Poisson distribution.
The Poisson Distribution is applied to model the number of events (counts) or occurrence per interval or given period (could be arrivals, defects, failures, eruptions, calls, etc.). This models discrete random variables.
The Exponential distribution is applied to model the mean time (such as waiting times) between occurrences, time is a continuous variable.
Example using Poisson Distribution
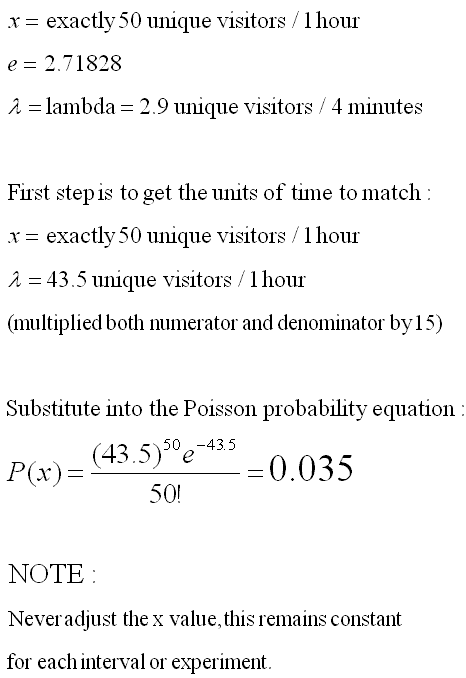
A new website has an average random hit rate of 2.9 unique visitors every 4 minutes. What is the probability of getting exactly 50 unique visitors every hour?
Given information:

Recommended video on the Poisson Distribution
Templates, Statistics Tables, and Calculators
Return to the Six-Sigma-Material Home Page
Site Membership
Click for a Password
to access entire site
Six Sigma
Templates & Calculators
Six Sigma Modules
The following are available
Click Here
Green Belt Program (1,000+ Slides)
Basic Statistics
Cost of Quality
SPC
Process Mapping
Capability Studies
MSA
Cause & Effect Matrix
FMEA
Multivariate Analysis
Central Limit Theorem
Confidence Intervals
Hypothesis Testing
T Tests
1-Way ANOVA
Chi-Square
Correlation and Regression
Control Plan
Kaizen
MTBF and MTTR
Project Pitfalls
Error Proofing
Effective Meetings
OEE
Takt Time
Line Balancing
Practice Exam
... and more


